Hey there! Welcome to our very first lesson, where we’ll show you just how easy it is to use the data from our sensors with our awesome dashboards!
The Shop Windows
Just like a website, shop windows serve as the initial point of contact where customers engage with your store's brand. By strategically positioning our devices on retail windows, we can effectively analyze the engagement levels of the display and its correlation with customer entry rates.
Here an example of a week of data in a store with 2 windows.

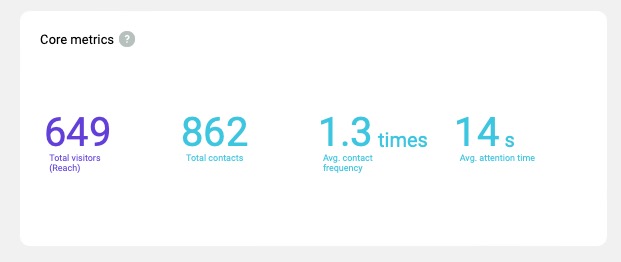
To commence, it is important to recognize the significant visitor engagement generated by the shop windows. The two displays successfully attracted a total of 649 visitors, with an average attention duration of approximately 14 seconds.

Excellent! We can now dive into the engagement of the shop windows. What does this signify? It showcases the time your visitors are captivated by your store's display. This is a great indicator! With 133 visitors drawn to the shop windows, it's clear that your presentation is making a strong impression.

Next, it is essential to analyze the demographics of the visitors. Were we able to engage the appropriate target audience? What are the gender and age profiles? In this instance, the establishment is a luxury women's retail store that offers a diverse range of brands, specifically designed for its clientele. The shop windows are effectively drawing in the desired demographic, with a visitor composition of 70% female and 30% male.

Regarding the age demographic, as indicated below, my target audience comprises women aged 45 and older. This represents the ideal market segment. Excellent work, they remain my primary focus.

The feedback from visitors indicated that 93% found the experience to be normal, 5% expressed satisfaction, a noteworthy 1% were surprised, while a small number reported dissatisfaction. We can work on it.

As a result, we have effectively attracted a considerable influx of visitors to our shop windows, successfully engaging the appropriate audience with a compelling atmosphere. They are now poised to enter my store!
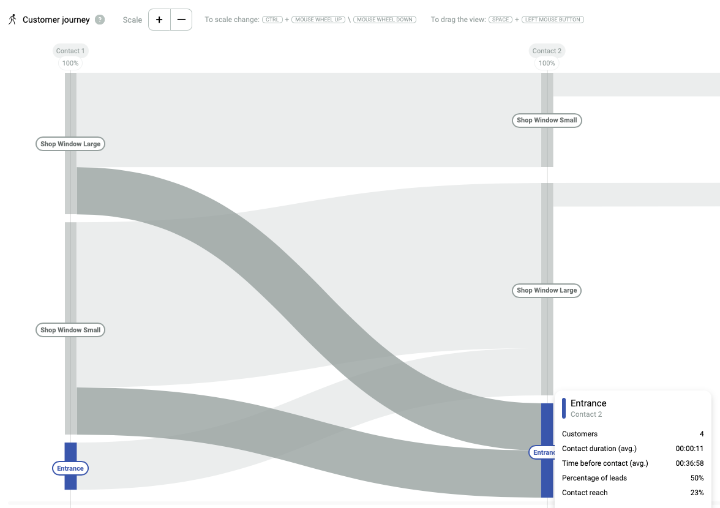
We now have the opportunity to gain valuable insights into how many visitors are drawn into the store after engaging with our captivating shop windows. By leveraging our Customer Journey dashboard, we can strategically analyze the conversion rate and enhance our customer experience.
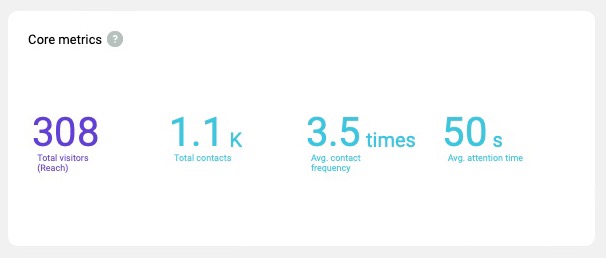
Before we proceed, let's take a look at the number of visitors who entered my store. As indicated below, there were 308 unique visitors this week.

Engaging with this demographic. The suitable audience. Women who are 45 years old and older.

What is the estimated number of visitors who were compelled to enter the store as a result of the strategically designed shop window displays? Unfortunately 4 only!

By utilizing this number, we have a fantastic opportunity to significantly boost the conversion rate of our shop windows campaign. Let's strategically compare the new layout with the previous one, carefully selecting the items, colors, and prices we display to captivate our customers and drive sales.
Conclusions
I revealed how you can unlock the full potential of your store's window display by leveraging our dashboards, allowing you to assess performance not only in terms of quantity but, crucially, in quality as well..
Now, you have an incredible opportunity to unlock the true potential of your shop windows by analyzing their return on investment (ROI) in terms of both your investments and conversion rates. Imagine being able to leverage our cutting-edge technology to not only measure the ROI of your online and offline advertising efforts but also to attract more visitors to your store than ever before. This is just the beginning, and we’ll explore this exciting topic in our next lesson!